Power BI Projects
Project 1 - 2022 Gujarat Assembly Elections
I created a Microsoft Power BI Visualization Report highlighting the 2022 Gujarat Legislative Assembly election. Key functions include a custom map of the Gujarat Assembly, scrolling data fields, KPI indicators, tooltips, and linking images and websites with data sources. This project provided valuable hands-on experience in data visualization, report creation, and leveraging advanced features within Power BI, enhancing my proficiency in analyzing and presenting electoral data effectively.
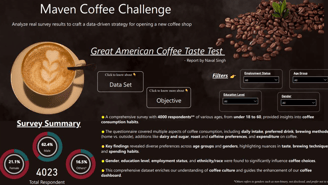
Project 2 - Maven Coffee Challenge
Using Power BI, I designed a dashboard for the Maven Coffee Challenge, sourcing data from the Great American Coffee Taste Test. Employing DAX calculations, I determined the coffee's target audience, identified product offerings, and formulated pricing strategies, aiming to enhance marketing effectiveness and competitive positioning in the market.

Project 3 - Tekken & Street Fighter Dashboard
I developed a Power BI Dashboard for Tekken & Street Fighters Characters, incorporating dynamic images and character videos through custom HTML codes, enhancing the visual experience and interactivity of the dashboard for a more engaging user interface.
Project 4 - Spotify Dashboard
I crafted a dynamic Power BI Dashboard for Spotify Songs & Artists, leveraging ChatGPT & Python to enrich the dataset. A Glassmorph Background and HTML Cover Art enhance aesthetics. DENEB Visuals and Power BI Formatting ensure clarity and a seamless user experience, elevating the dashboard's effectiveness.
Project 5 - Nike Product Showcase
I developed a new project on Power BI called the Nike Product Dashboard, utilizing the latest Cards & Slicers features introduced by Microsoft. This dashboard showcases NIKE products, particularly the Jordans, using slicers' image functions, demonstrating the brand's offerings in an innovative way.
Project 6 - Lego Products Dashboard
I developed a new Power BI project, the Lego Dashboard, examining set figures and key trends like action-adventure genres or Star Wars. Analyzing sales quantities, mini Lego sets, and historical trends, the dashboard aims to provide insights into the Lego market's dynamics and consumer preferences.
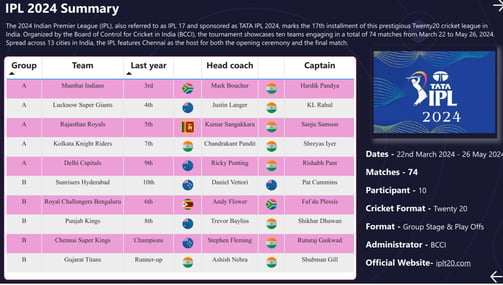
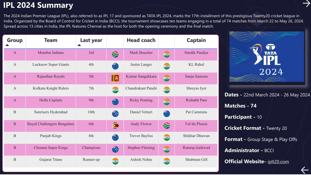
Project 7 - IPL 2024 Codebasics Challenge
In my recent Power BI project, I fused my passion for cricket with newfound data analysis skills. Tasked with boosting 'Sports Basics' website traffic through an IPL 2024 special magazine, I utilized detailed dashboards to analyze player and team metrics, forecasting top performers and the tournament champion. Explore insights below.
Project 8 - Oil Consumption Dashboard
For my latest project, I developed a Power BI Dashboard analyzing the oil consumption of 20 countries. I utilized the IBCS Template and integrated Deneb custom visuals including donut and chips charts, as well as SVGs, to enhance data visualization and insights presentation.
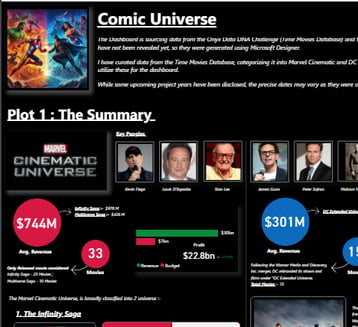
Project 9 - MCU vs DCU
Here's my dashboard featuring the Comic Movies Collection, delving into the comparison between MCU (Marvel Cinematic Universe) and DCEU (DC Extended Universe).
I've developed this dashboard for submission to the ONYX Data Times Movies Database challenge. Crafting this dashboard for comic movies has been incredibly rewarding, tapping into the nostalgia of childhood dreams associated with these iconic films.